A real-time dashboard, from back-end to micro services with scalable front-end for operation centers
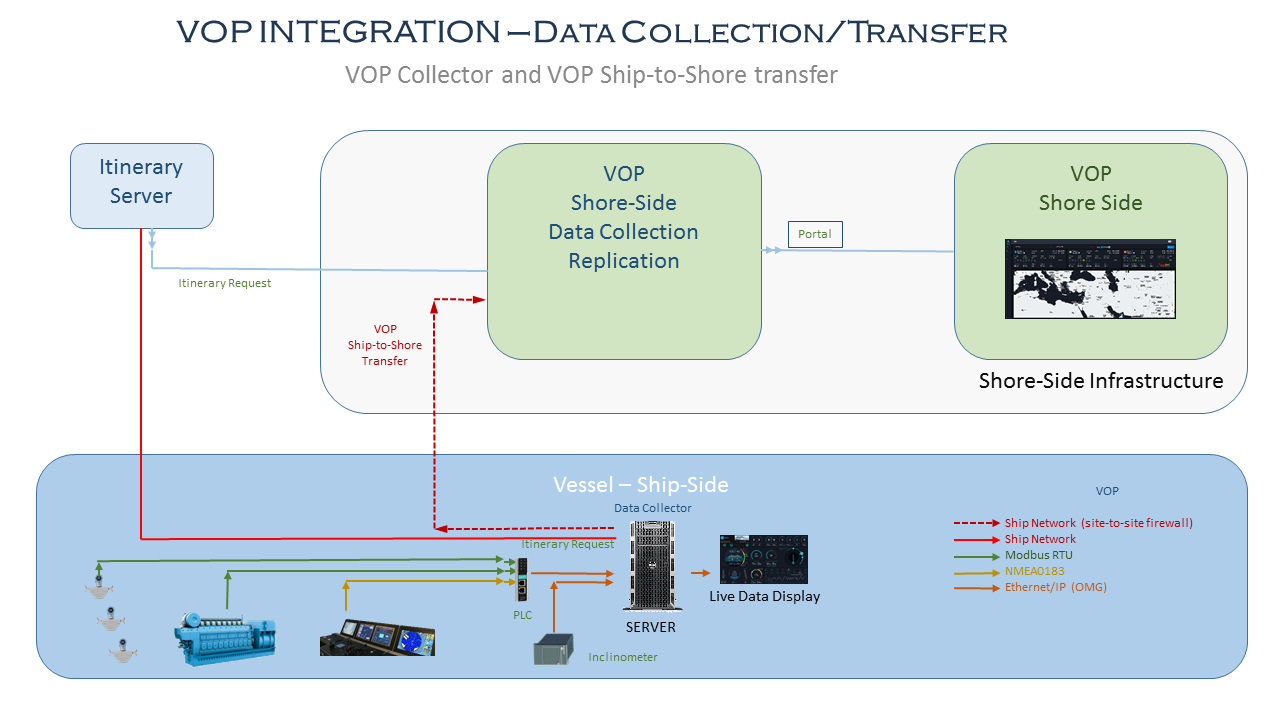
VOP stands for Vessel Optimization Platform. This powerful & Web Accessible software integrates with the EconoMaster and has two main functions:
- Receive and historically log the raw data from the EconoMaster
- Transfer your Data in real-time from Ship to Shore and allow you to observe your ship’s data from the comfort of your Desk or mobile device
VOP is a highly customizable software that allows your Data to be displayed in the form of graphics, trends and calculated formulas to just mention a few.
The versatility of the platform allows for the VOP software to be applied and customized to any process regardless of the data sources.
VOP has been designed to be the ULTIMATE Historian & Real-Time Data Display Tool.

The HUB screen on the VOP portal welcomes the user to a summarized view of the whole fleet, each of the vessel’s card displays data pertinent to each vessel current operation. The front-end technology deployed allows for the portal to be used and displayed in control rooms and global operation’s control centers.
The high level of analytics developed for the VOP software is what feeds the real-time modules and reports currently present in the portal. Those calculations can also be drawn live or can be stored in the system.
By pulling different type of data points from different sources, the Vessel Card provides a comprehensive view of the vessel in real time. This data can be further analyzed by going into the Vessel Dashboard, where more in-depth analytics and situational awareness indicators are present, like Fuel Decomposition, Trim Performance, Engine Consumption and Engine Performance.
The Report capabilities of the VOP portal include Trim Performance, Hull Deterioration, Leg Analysis, Leg Comparison, Wheelhouse Instrument and the Trend Tool page where all data points, either captured values, calculated KPI and analytical metrics can all be displayed and exported.


